
EURJPY Trade setup 31st Jan, 2014
EURJPY Trade setup 31st Jan, 2014

Chart says it all ... don't you think?
Risk Level MEDIUM
Tips -
Always take note of any economical news event on our provided calender below
USDCHF Trade filled last night
USDCHF Trade filled last night
As per my analysis on monday we have got filled on our short order
We did reached 1:1 reward, but i am looking for more so have not taken partial yet.
Here is an update of the trade

USDJPY Trade setup taken partial profit + update of Chart
USDJPY Trade setup taken partial profit + update of Chart
Have taken partial profit as i've hit 1.5 reward to risk. Futher more please see h4 chart with good divergence showing further downside perhaps


USDJPY Trade setup 30th Jan, 2014
USDJPY Trade setup 30th Jan, 2014

Sell zone is approaching.
Will be shorting there with partial take profits when I have 1:1 - 1:1.5 then leave small portion to ride down to my anticipated level
Tips -
Always take note of any economical news event on our provided calender below
EURAUD Outlook and Trade Setup - 30th Jan, 2014
EURAUD Outlook and Trade Setup - 30th Jan, 2014
Daily Chart

- We have divergence in stochastic
- Perhaps one more drive up to new highs - maybe at my fib 161.8 ext level
Hourly Chart

- Double bottomed from major support on Monday and Tuesday, and also near the 61.8% fib retrace
- We have a short trade as shown on chart for a scalp from a fib ext and fib retrace level
- Our bias is we should have new highs
Outlook Trade opportunity
Current setup is already been filled, no further setup is spotted at this stageRisk Level __
Tips -
Always take note of any economical news event on our provided calender below
GBPJPY Outlook and Trade Setup for 30th Jan, 2014
GBPJPY Outlook and Trade Setup for 30th Jan, 2014
Daily Chart

- Our bias remains the same as analysis from Monday
- Will be interested to get long when reached support buy zones
Hourly Chart

- We saw rejection from the 61.8% fib retrace, which also was my scalp short entry on my monday's analysis. I know many traders who have got in short there as a classic setup of a fib 61.8.
- After three days of data since Monday's analysis, I have been able to setup our next counter trade zones. This is more like a scalp rather than a long term trade. However this could be the area where it will go higher, so, keep a very small portion on if you see the same
Outlook Trade opportunity
Please see Hourly chart for Long tradeRisk Level Low
Tips -
Always take note of any economical news event on our provided calender below
Analisis 30 January
EURJPY (H4)

Status : SL Hit
Entry : Buy Stop 139.72
Target 1 : 139.90
Target 2 : 140.15
Target 3 : 140.40
Target 3 : 140.40
Stop Loss : 139.00
GBPJPY (H4)
Status : SL Hit
Entry : Buy Stop 169.47
Target 1 : 169.70
Target 2 : 170.05
Target 3 : 170.35
Target 3 : 170.35
Stop Loss : 168.59
USDJPY (H4)
USDJPY (H4)
Status : Success!!
Entry : Buy Stop 120.34
Target 1 : 102.45 TP Hit!
Target 2 : 102.65 TP Hit!
Target 3 : 102.80 TP Hit!
Target 3 : 102.80 TP Hit!
Stop Loss : 101.80
Scalps for 29th Jan 2014 (USDCHF, EURAUD)


_____UPDATE***
Unfortunately both trades did not work which got filled pretty much few minutes after posting this.
Next trade -
I have got another EURAUD trade but too late to post as market moved too fast for me to prepare the chart, but i took the trade, which covered losses of earlier trade

USDJPY Outlook and Trade setup 29th Jan, 2014- Midweek report
USDJPY Outlook and Trade setup 29th Jan, 2014- Midweek report
Daily Chart

- Reason why i am using the Ichikumo indicator is that the yen pairs do respect this indicators more than any other currency.
- As you can see on the daily, it has rejected the clouds , however the lines (you can say the moving average line) is acting as minor resistance for the meantime
- Although the clouds have been rejected, we cannot ignore the fact that it looks bearish, and i would like this to reach my first level of support on my chart and go long. (note second level of resis, might not be reached)
Hourly Chart

- On the hourly, if we get into my sell zone, i would be looking to do a 80% scalp and leave 20% trade and possibly ride into new lows (as mentioned in Daily Chart)
Outlook Trade opportunity
Please see hourly chartRisk Level LOW
Tips -
Always take note of any economical news event on our provided calender below
EURUSD Outlook and Trade setup 29th Jan, 2014- Midweek report
EURUSD Outlook and Trade setup 29th Jan, 2014- Midweek report
Daily Chart

- Not much action for the first two days of the week as market anticipating moves after the Fed later today
4 Hourly Chart

- I have identified a potential Cypher Pattern similar to the AUDUSD setup.
Outlook Trade opportunity
Please see hourly chartRisk Level LOW
Tips -
Always take note of any economical news event on our provided calender below
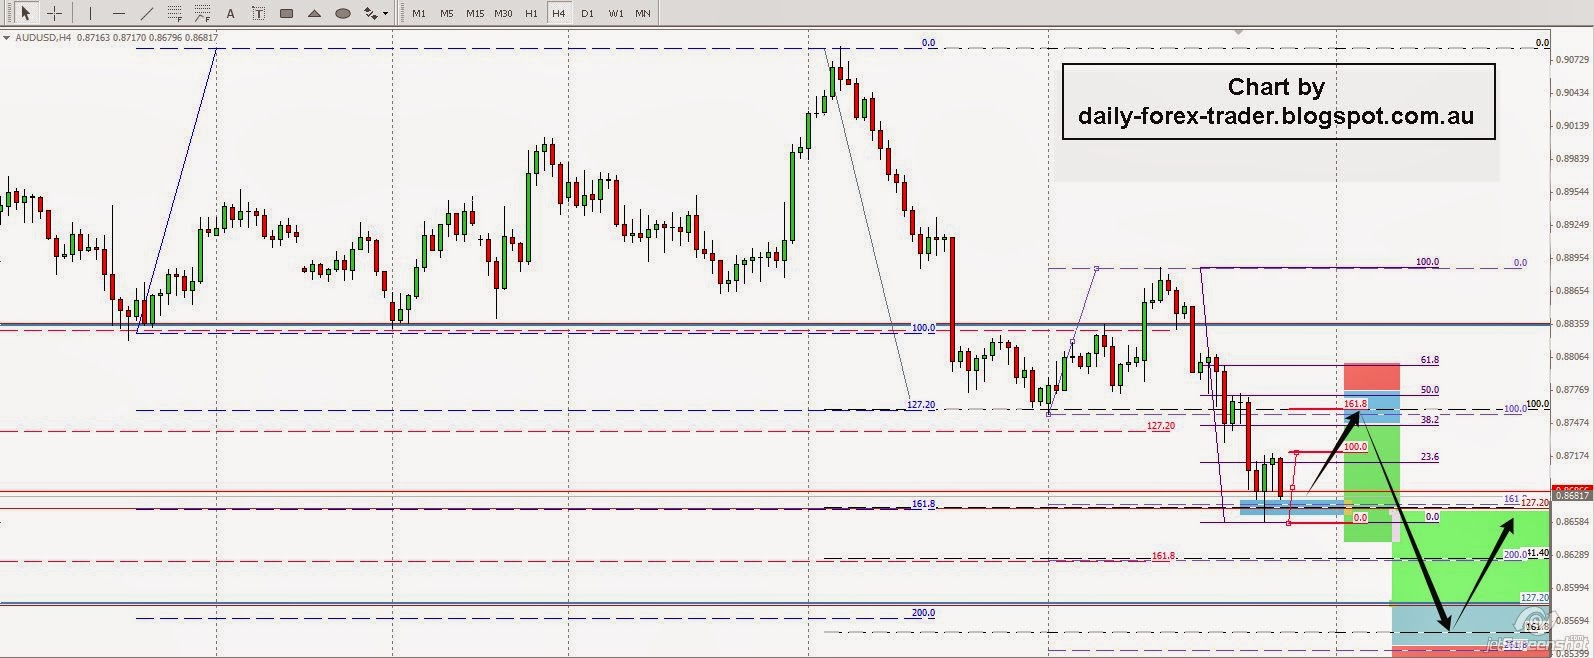
AUDUSD Outlook and Trade Setup Midweek update 29th Jan, 2014
AUDUSD Outlook and Trade Setup Midweek update 29th Jan, 2014
Daily Chart

- As predicted last Friday, we rejected from the confluence fib ext level of 161.8 and 127.2
- Upside is limited however with the major resistant, and if we break through, please be careful of a 'fake break'
Hourly Chart

- This is my forecast for this pair, and if it does get up to my sell zone, for those who look at patterns, i think its a potential Cypher pattern. -
- Next support bounce is also on chart
Outlook Trade opportunity
Please see H4 chartRisk Level LOW
Tips -
Always take note of any economical news event on our provided calender below
USDCHF Outlook for the week 27th - 31st Jan, 2014
USDCHF Outlook for the week 27th - 31st Jan, 2014
Daily Chart

- Our bias for this week is bullish as we had rejected the monthly pivot, which also is confluence level of 61.8 fib back
- Descending Trendline was broken (not shown on chart), however fell back into it slightly after Last Thursdays big candle
Hourly Chart

- On the hourly chart, price action is moving upwards, (slowly)
- Although bias is bullish for the week, i have a short trade as shown on chart
Outlook Trade opportunity
Please see H1 ChartRisk Level LOW
Tips -
Always take note of any economical news event on our provided calender below
GBPJPY Trade Setup for 28th Jan, 2014 Tuesday
GBPJPY Trade Setup for 28th Jan, 2014 Tuesday

Scenario - If data comes up above average / slightly positive
- The second counter trend would be a nice one to take which would line up with fib confluence together with ADR range as well as a Supply and Demand level.
- First counter trend will only take if price gets there 2 hours prior to news event
Risk Level Medium
Tips -
Always take note of any economical news event on our provided calender below
EURGBP Trade Setup for 28th January, 2014
EURGBP Trade Setup for 28th January, 2014

We have economic data for GBP later today so if outcome is neutral or slightly positive, we will take the first counter trend
If data is good, we will then take the second counter trend trade.
Notes - we have broken support, last week and recovered , some of you's would say its a 'false breakout' - please see daily chart.

Risk Level HIGH
Tips -
Always take note of any economical news event on our provided calender below
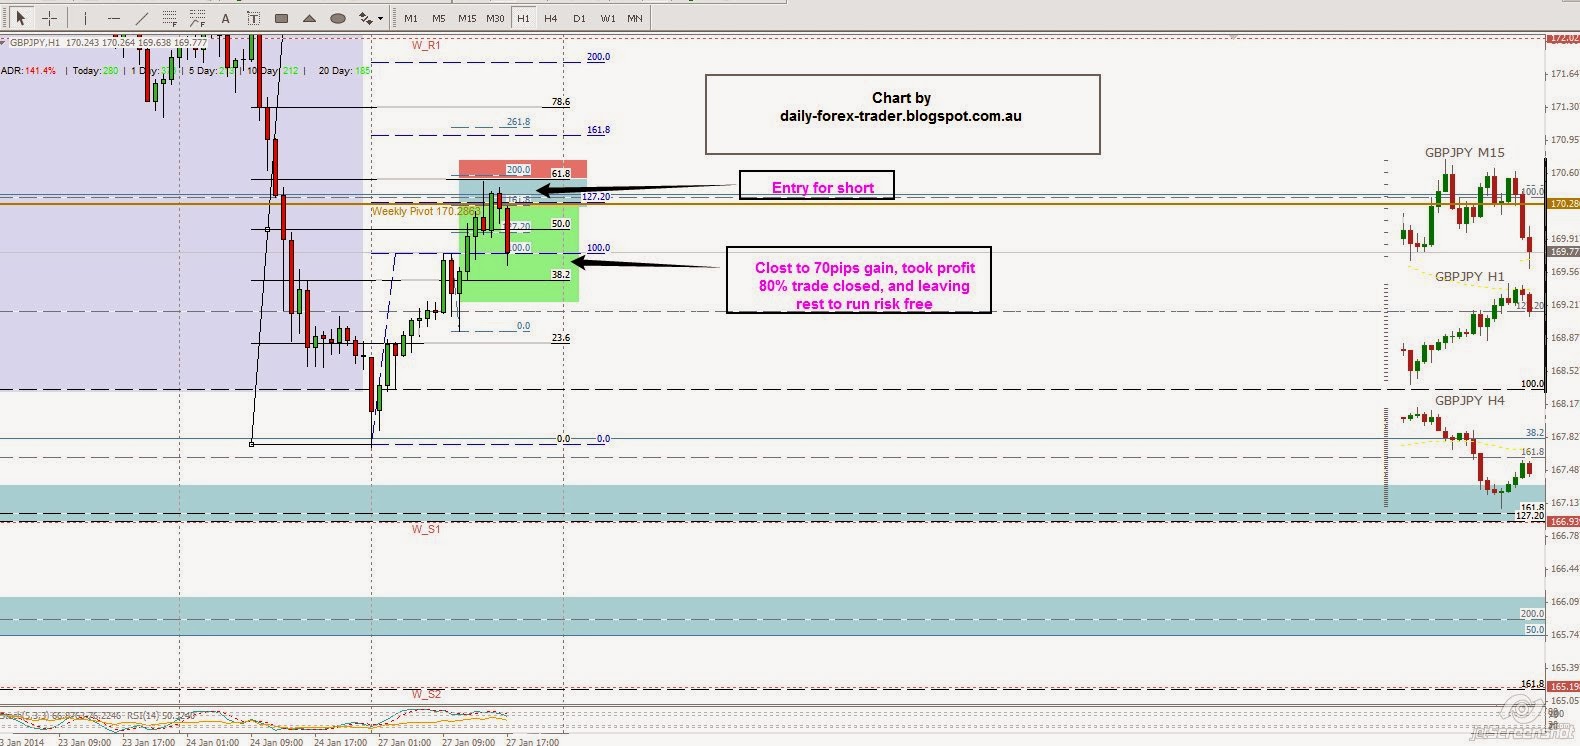
GBPJPY 15min Setup 27th Jan, 2014 (Monday)
GBPJPY 15min Setup 27th Jan, 2014 (Monday)

- Confluence levels
- weekly pivot
- Around 50% and 61.8% retrace fib level
- Fib ext of 127.2% from swing from today
- Fib Ext inverse of 161.8% retrace of today
- 1hr chart stochastic Divergence
***Updated***Trade successfulWith 70pips and take profit closing 80% of trade size, leaving rest to run risk free
- weekly pivot
- Around 50% and 61.8% retrace fib level
- Fib ext of 127.2% from swing from today
- Fib Ext inverse of 161.8% retrace of today
Gold Outlook for the week 27th Jan, 2014
Gold Outlook for the week 27th Jan, 2014
Daily Chart

- We have broken the resistance, and our next resistance hurdle is at the 127.2 ext (around 1290).
- Divergence is showing on stochastic and RSI
Outlook Trade opportunity
I would have two trade setups both counter scalpsone at around 1290
and another at around 1320 (however, would not do a pending as of yet until closer time)
Aggressive traders could go long after a retest of the support ,
Risk Level High -- because its my first setup for gold
Tips -
Always take note of any economical news event on our provided calender below
GBPJPY Outlook for the week 27th Jan 2014
GBPJPY Outlook for the week 27th Jan 2014
Daily Chart


We have a clear indication of a bearish sentiment as we have a clear lower highs.
But we have not performed lower lows yet. We are playing into support and the daily candle looks very bearish , So would not be surprised if support is broken, If support is broken, we will be looking for confluence levels with ichimoku clouds (As its a Japanese indicator, it usually respects it on a yen pair)
On the daily chart, I have two scenarios (in different colors)
Hourly Chart

Outlook Trade opportunity
This one as you can see i have no trade setups however all the Blue highlighted levels , we should expect some sort of bounce for a scalp.When i clearly see an opportunity, i will upload on my blog
Risk Level n/a
Tips -
Always take note of any economical news event on our provided calender below
AUDUSD outlook for the week 27th Jan, 2014
AUDUSD outlook for the week 27th Jan, 2014
Daily Chart

The bearish sentiment continues
- Divergence is spotted on stochastic
4 Hourly Chart
Hourly Chart

Outlook Trade opportunity
Would be selling at a retest of resistance which was support before breakout, and a Long order at major support (pls see 4hr / 1hr chart)Risk Level Low
Tips -
Always take note of any economical news event on our provided calender below
USDJPY Forecast for the week 27th Jan, 2014
USDJPY Forecast for the week 27th Jan, 2014
Daily Chart

Last week my view was bullish due to the bullish engulfing candle formed, However we are clearly in a short term bearish run / correction.
- Ascending trend line is near
- On yen pairs, using ichikumo indicator is ideal, and if you put it on the daily chart, we are hitting the clouds / supports/ and the 101.300 approx is in the clouds
- On the chart, there are two support levels to look for trades
4 Hourly Chart

Hourly Chart

- After breaking support, We would be looking to sell on the retest which now is resistance.
- The next level of support is drawn on the hourly where a possible bounce scalp is possible / also shown on 4hr chart
Outlook Trade opportunity
There are three possible trades2 are shown on 4hr chart
2 are shown on 1hr chart, however one of the trades are a repeat of the 4hr chart
Risk Level - Medium
Tips -
Always take note of any economical news event on our provided calender below
EURUSD outlook for the week of 27th Jan, 2013
EURUSD outlook for the week of 27th Jan, 2013
Daily Chart

The euro has bounced of the 61.8 retrace level and ascending trend line (from June 2013), which was supported by divergence and also economical news which give its push. We are trading into resistance now, so we have to watch closely at price action / daily candles.
- There is divergence (unfortunately not drawn on chart sorry), where we have higher high, but lower highs in stochastic.
- Trading into resistance, with Friday's Candle seems to have a exhaustion pin bar.
Summary - This would be hard to analyse as we are trading up into resistance, however for aggressive traders we could go short and have stops above the highs from Friday.
4 Hourly Chart

- The Stochastic seems to me that it wants to push price up,
- On chart are two counter trade setups if we break resistance
Hourly Chart

- I have not shown the stochastic indicator window, however i could tell you it is pushing up which makes this pair breaking resistance more of a possibility
- On the chart, there are two possibility, One is a trend continuation, and second is a counter trend
Outlook Trade opportunity
We have 4 x setups as shown on the Hourly and 4 hourly charts.Risk Level Medium
Tips -
Always take note of any economical news event on our provided calender below

AUDUSD Trade Setup

The Aussie traveled as per my analysis from Monday's setup.
I have another Low risk high reward setup as shown on my chart.
I have another Low risk high reward setup as shown on my chart.
EURUSD Trade Setup
EURUSD Trade Setup
There was only one setup filled and profited from my analysis on Monday.
The EURUSD clearly found some bullish momentum after reacting from the 61.8% retrace level and which also is a Supply and Demand level dated back to late NOV 2013. I will provide a proper analysis on Monday, however I had quickly found a possible setup for today

EURGBP forecast Analysis and Trade Setup 23rd Jan, 2014
EURGBP forecast Analysis and Trade Setup 23rd Jan, 2014
Daily Chart

- We have broke major Support with a big Bearish day candle yesterday
- Clearly still in a downtrend
- Currently found expected support at the 127.2 extension / 161.8 extension
- We expect further push down slightly before a counter trend trade where a stronger support at the confluence levels of (as highlighted in blue box)
- Monthly PIVOT S2
- 61.8% retrace from a big uptrend on a daily
- 200 fib ext of the most recent reverse retrace of the down trend (sorry i don't know the correct word for this)
- 141.4% fib ext of oct 29 to dec 02 down swing (fib level not shown on graph)
- 161.8 fib ext (old level, which was previous s/r
4hr Chart

- Clear down trend
- The 4 hour chart is a zoomed in scenario of my trade setup where we can identify smaller swings and calculate more accurately the fib ext levels for entry.
Hourly Chart

- Clear Down Trend
- On the hourly chart we are looking for a retrace of our broken support which now is resistance
- We can enter at the 161.8 fib ext and have stops above 200 fib ext - this is a trend trade
Outlook Trade opportunity
Two opportunity1 is Trend Trade - see hourly chart
2nd trade is counter - see 4hr / daily chart
Risk Level LOW
Tips -
Always take note of any economical news event on our provided calender below
Analisis 22 January
USDCHF (Daily)

Status : Success..!! (209pip)
Entry : Sell Stop 0.9083
Target 1 : 0.9050 (Hit TP!)
Target 2 : 0.9020 (Hit TP!)
Target 3 : 0.8980 (Hit TP!)
Target 3 : 0.8980 (Hit TP!)
Stop Loss : 0.9160


USDCAD (Daily)
Status : Not valid
Entry : Sell Stop 1.0941
Target 1 : 1.0855
Target 2 : 1.0805
Stop Loss : 1.1022
Subscribe to:
Posts (Atom)


