Showing posts with label USDCHF. Show all posts
Showing posts with label USDCHF. Show all posts
USDCHF Forecast and Trade Setup For the week 26th May, 2014
USDCHF Forecast and Trade Setup For the week 26th May, 2014
Weekly Chart

- We have continued the bullish momentum last week after rejection from the Monthly Pivot Support few wks ago
- Ichimoku Study - Bearish
Daily Chart


- After flirting around the Resistance area, we managed to break through it. Any retest should perform a bullish candle setup signal on a smaller timeframe
- I have put in another chart with 3 Moving Averages Study,
- Note that we are hitting against the 200 Day Moving Average and very close to next resistance
- I have drawn in some projections on the Daily chart but only vaguely.
- Taking a short is against the strong trend
- Taking a long now - we are hitting resistance soon / and 200MA is hitting right now
- Ichimoku Study - Bullish
Hourly Chart

- Very strong bullish run, where now we will wait for retrace to the broken resistance which should become support together with the ichimoku clouds
Outlook Trade opportunity
Would be interested for a retest of the broken resistance which now should become support., Placing stops on the immediate previous swing lowRisk Level MED - HIGH
Tips -
Always take note of any economical news event on our provided calender below

USDCHF Forecast and Trade Setup for the week 12th May, 2014
USDCHF Forecast and Trade Setup for the week 12th May, 2014
Weekly Chart

- A very clear signal from the Bullish candle from a strong support showing perhaps we could go on a bullish trend? This is in conjunction with
- Break of Bearish chanel and the retest shows a strong reversal signal as well
Daily Chart

- A false break of a newly developed bullish channel with a very good strong bullish candle from support
- As well as bearish clouds are thin and with the strong bullish momentum looks like it will break
Hourly Chart

- As per Daily and Weekly, bullish momentum should continue to at least the Monthly pivot, before a retracement perhaps before breaking the MR1
Outlook Trade opportunity
LongRisk Level Low
Tips -
Always take note of any economical news event on our provided calender below
USDCHF Forecast for the week 22nd April, 2014
USDCHF Forecast for the week 22nd April, 2014
- Bullish Cypher still in play
Weekly Chart

- Last weeks price action was bullish and we recovered nearly half of the sell off of the previous wk prior
Daily Chart

- We had continuous bullish price action daily candles
- Broke through resistance, however nearing another minor resistance
- We are also trading in the ichimoku clouds and Stochastic is trading in a overbought zone
Hourly Chart

- As you could see the bullish cypher identified over a week ago did play out quite well
- This is a 4 Hourly chart, where we have broken through the Ichimoku clouds, however we are in an area of potential resistance (yellow zone) and market could retrace to the downside to test the support zone in the following days.
- We are also travelling on the upper line of the ascending channel.,
Outlook Trade opportunity
We could take a short if a convincing hourly / 4hr shooting star candle is rejected from the yellow zone.If market does test the support, we could wait for a bullish hammer formation to continue the up trend
Risk Level Low
Tips -
Always take note of any economical news event on our provided calender below
USDCHF Forecast for the week 14th April, 2014
USDCHF Forecast for the week 14th April, 2014
- New lows?
- Bullish Cypher ?
Weekly Chart

- Very Bearish Candle after market retest resistance level,
- With the heavy momentum it will not surprise us if we break below the lows of 2014 and find the major support level as shown on the chart
Daily Chart

- Daily candle is a doji which suggest a pause on the bearish run, and more often suggest a reversal
Hourly Chart

- Identified this cypher pattern which suggest a correction
- Last few hours Price action does show some strength of the bulls
- MACD - (not shown on chart) is starting to cross
Outlook Trade opportunity
Lightly counter trade this Bullish cypherRisk Level Medium
Tips -
Always take note of any economical news event on our provided calender below
USDCHF Forecast and Potential Cypher Trade Setup 11th April 2014
USDCHF Forecast and Potential Cypher Trade Setup 11th April 2014
Daily Chart

- On a Daily Chart we could see a huge fall continuous for 4 days
- Fall from ascending channel
- Looks bearish and some may argue we could find lows as we continue the bearish tone. However I have spotted this cypher pattern which could work nicely due to the fact these patterns if formed at top and bottoms work much better
Hourly Chart

- We have a potential Cypher Pattern
- Stochastics is extremely oversold but remains in the oversold (slight divergence) - this doesn't mean anything but still in a bearish mode
- RSI - slight divergence where its starting to head up above 30
Outlook Trade opportunity
I would place Long trade now with stops below the XRisk Level Medium
Tips -
Always take note of any economical news event on our provided calender below
Daily Candle's To note for Monday 7th April, 2014
Daily Candle's To note for Monday 7th April, 2014
USDCHF Shooting Star (4)
EURUSD Bullish Hammer (2)
EURGBP Bullish Hammer (2)
GBPCHF Shooting Star (4)
CADJPY Shooting Star (4)
AUDJPY Shooting Star (4)
EURCHF Shooting Star (4)
AUDUSD Bullish Engulfing Pattern
Outlook Trade opportunity
If these candles are at or near support and resistance, it may be a chance for a reversal
USDCHF Forecast and Trade Setup for 26th March, 2014
USDCHF Forecast and Trade Setup for 26th March, 2014
Daily Chart

- Shooting Star Candle on the Daily
- Stochastics crossing
Hourly Chart

- Stochastics and RSI divergence
Outlook Trade opportunity
As shown on 4hr chartRisk Level LOW
Tips -
Always take note of any economical news event on our provided calender below
USDCHF Forecast and coming Potential Support level
USDCHF Forecast and coming Potential Support level
Monthly Chart

Daily Chart
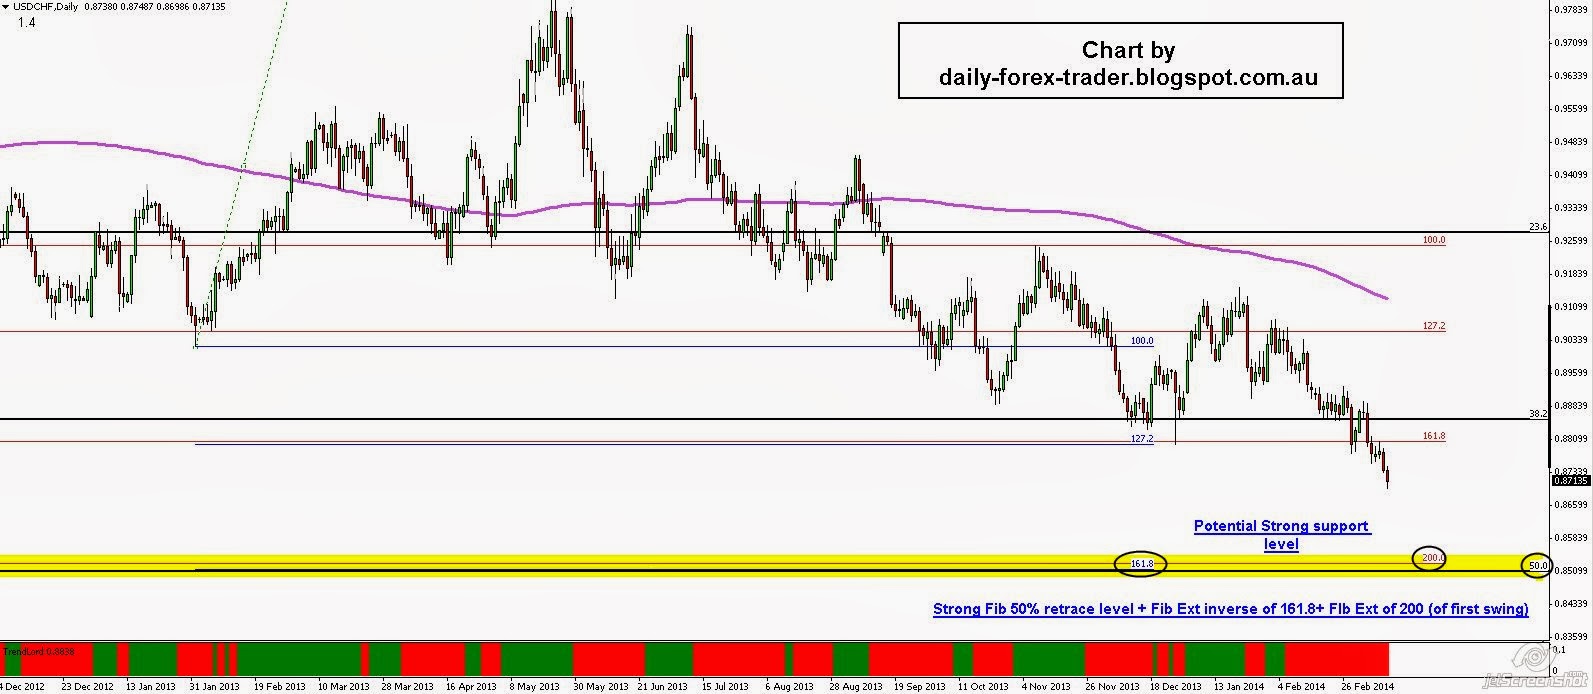
- As we break previous support, There is a wide gap until I can see any support - (You maybe able to see on a weekly chart)
- Using fibs retrace and ext, i have identified a potential strong support level which also is few pips BELOW possible supply demand area on the weekly chart.
Summary
If Market is to get to those areas, there would be a possible trend change perhaps (should see the US Dollar Index chart to confirm)
Cheers
USDCHF Outlook & Trade Setup for the week 3rd - 7th February 2014
USDCHF Outlook & Trade Setup for the week 3rd - 7th February 2014
Outlook Trade opportunity

Risk Level Low
***Update***trade successful took 2:1, and took 80% of the table, and leaving 20% to run lower, as i see it can run lower

Tips -
Always take note of any economical news event on our provided calender below
USDCHF Trade filled last night
USDCHF Trade filled last night
As per my analysis on monday we have got filled on our short order
We did reached 1:1 reward, but i am looking for more so have not taken partial yet.
Here is an update of the trade

Scalps for 29th Jan 2014 (USDCHF, EURAUD)


_____UPDATE***
Unfortunately both trades did not work which got filled pretty much few minutes after posting this.
Next trade -
I have got another EURAUD trade but too late to post as market moved too fast for me to prepare the chart, but i took the trade, which covered losses of earlier trade

USDCHF Outlook for the week 27th - 31st Jan, 2014
USDCHF Outlook for the week 27th - 31st Jan, 2014
Daily Chart

- Our bias for this week is bullish as we had rejected the monthly pivot, which also is confluence level of 61.8 fib back
- Descending Trendline was broken (not shown on chart), however fell back into it slightly after Last Thursdays big candle
Hourly Chart

- On the hourly chart, price action is moving upwards, (slowly)
- Although bias is bullish for the week, i have a short trade as shown on chart
Outlook Trade opportunity
Please see H1 ChartRisk Level LOW
Tips -
Always take note of any economical news event on our provided calender below
Subscribe to:
Posts (Atom)


